
Part 2: Where to Look for Gains
In part one, we explained why a hotel revenue director needs to feel comfortable examining and suggesting enhancements to the actual casino customer valuation method, specifically core gaming metrics which are often seen as the exclusive domain of casino marketing.
In part two, we suggest areas where you might be able to find improvement opportunities.
Initially, when you inquire about the core valuation calculations, you may hear how advanced the method is, and how the company truly understand their customers on a one-to-one basis. Statements like these usually describe an aspiration more than a reality, particularly as the never-ending, deafening drumbeat of database marketing deadlines (e.g., getting the monthly offers out the door) tends to be the overwhelming priority.
Even if you’re working with one of the large nationwide US operators, don’t be surprised if you peel back the layers only to learn that the casino segmentation ultimately only comes from average daily theoretical (ADT) or average daily worth (ADW). As a reminder, these basic calculations look like this:
- ADT: Theoretical Worth / Gaming Days
- ADW: The greater of ADT or x% of Actual Win
If you find these are your common valuation metrics, then you know there’s a significant opportunity to suggest improvements
Consider Nights Rather Than Days
This one is surprisingly simple and very often not in place. If the core gaming valuation is either ADT or ADW, then the aggregated worth for the trip is divided by the number of gaming days. In the case of a hotel stay, however, the number of days isn’t quite as meaningful as the number of nights, particularly since room-nights are the core currency being traded in the hotel yield game. A quick example will explain this best:
- Phil and Jerry have largely the same gaming habits. They are both arriving Tuesday for an overnight stay and are destined to achieve $500 in theo on their trip.
- Phil plays to a 500 theo within four hours on Tuesday evening, goes to bed at midnight, and leaves the property first thing in the morning, playing nothing at all on Wednesday.
- Jerry earns 250 in theo on Tuesday evening and plays again on Wednesday morning, earning another 250 in theo.
- At the end of the trip, each player has generated 500 in theo associated with their Tuesday night stay.
- But Jerry will have an ADT of 250 while Phil has an ADT of 500. Since we’re dividing by gaming days, Phil’s 500 in theo (having occurred all in one day) is only divided by one. Jerry’s theo is divided by two days and is therefore cut in half.
- But, as we stated at the beginning, both players generated 500 in theo on their Tuesday night stayover.
The math behind this example is not complicated. We’re not talking about advanced quantitative or statistical methods here; in fact, the underlying math is the type of thing we learn in the fourth grade. The same is true for our next example.
Consider Removing Quick Trips
In markets that are highly dependent on frequent visits by loyal locals, traditional gaming valuation methods can actually deter the specific behavior the loyalty program is meant to encourage. Indeed, it’s fascinating to see how the use of broad averages in the valuation method can counteract the goals of the program.
When using the ADT or ADW metrics, it is key to remember that the “A” stands for “average”. And, as we mentioned above, the basic unit across which metrics are averaged tends to be the day, or possibly the trip.
Naturally, the valuation a player achieves on an individual trip is an important component of their average. Of course, the fewer the trips, the greater the role each trip plays in the average. Incidentally, we’re still only talking about fourth-grade math here, and it’s not going to get any harder.
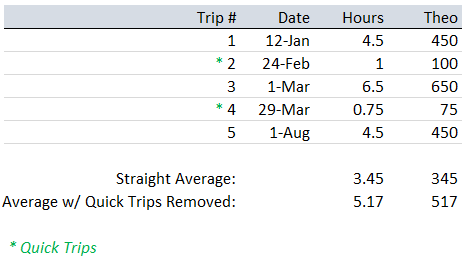
Picture a local player who has five trips within a 12-month period. For simplicity, assume they play steadily at a rate where they earn 100 theo per hour. But they don’t always play for a long period of time. This player will often play for 4-5 hours when they come on a weekend night. But once in a while, they will stop in on the way home from work and just play for an hour or less.
In the example below, of the five trips the player has had, two of them could be considered quick trips since they fall meaningfully below the overall average of hours played and theo earned. In the traditional method, the player would be valued with an average trip theo of 345. But, if these quick trips were removed, the player would be valued at 517. The difference between these two worth values could be enough to award the player access to a weekend room-night, which they might not get otherwise.
Incidentally, frequent loyal players often know how these averages affect them. And, of course, they work out ways to get what they need. In speaking with regular players (locals, in particular), you might find that they elect not to use their club card to get rated when they’re just popping in for a quick visit. While this “off the grid” method is precisely what a rewards program is typically designed to discourage, without a process in place to remove meaningfully marginal trips, a players club program can actually encourage this behavior.
Part 3: Measuring Success
In the preceding sections, we opened up the concept that a revenue director should feel comfortable (and responsible) to break open the casino player valuation method and make changes. We also provided a small sampling of ideas where improvements could be made. These simple examples are only the beginning, as there are certainly more areas to look for improvement.
This section will focus on how to know if any changes have been effective. Naturally, it’s important to clarify the goals of these improvements and how to measure them. In this space, the goals of one property might be quite different than those of another. For instance, one property might feel they are giving away too many comp rooms on weekends and would like to tighten things up whereas another might find they are consistently falling short of occupancy goals and would like to become less restrictive.
Naturally, it is the revenue director’s remit to change the comp criteria for weekends and weekdays, and simply sliding the scale up and down is a common reaction. But, if the goal is to truly optimize the use of the hotel asset, an important goal would be to find hidden gems in the existing database and provide more incentive for these players. The cases reviewed above are good examples of this – existing players with identifiable patterns for whom the basic average method does not really work.
Goal: To find more valuable customers in the existing database and provide them access to rooms at a level higher than they’ve previously enjoyed.
Preview The Migration: Once you’ve made a move to change the valuation method according to one or more enhanced calculations, it’s a good idea to see how the new valuation scheme and the pre-existing valuation scheme compare across the database. A useful tool to measure the migration of accounts is illustrated below. This shows the current segments on the vertical axis and the proposed segment across the top. The players shown in the blue boxes were unchanged, but all the others have migrated in some way. So, you can see that of the 1,070 players in the current 750+ segment, 480 were moved up to the 1,000+ segment and another 44 were moved all the way to 2,500+.
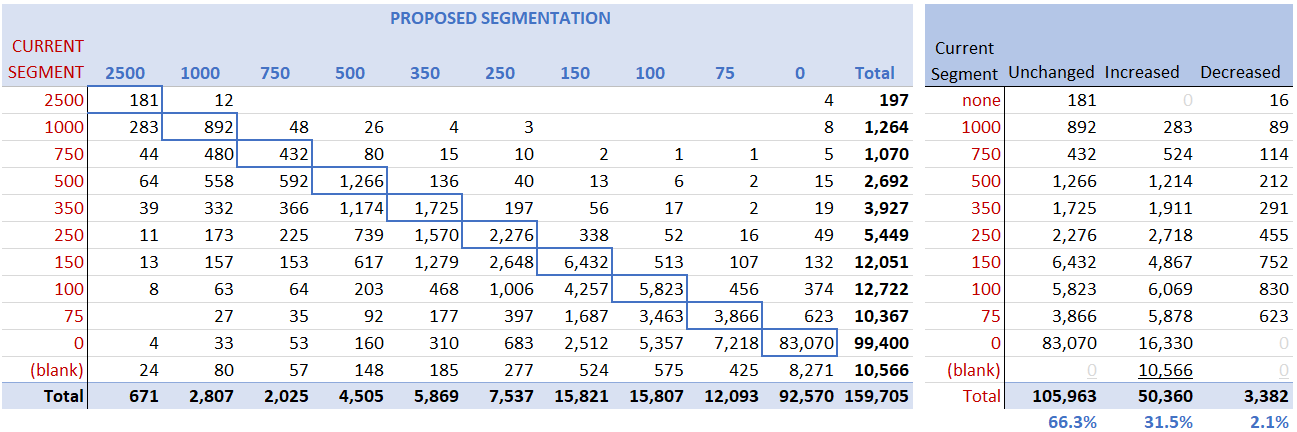
Here, it’s easy to see how players have migrated from their pre-existing (current) segments to the new (proposed) segments. In the example above, the new scheme would give 31.5% of the players a bump in their valuation, only 2.1% would decrease, and 66.3% would remain the same.
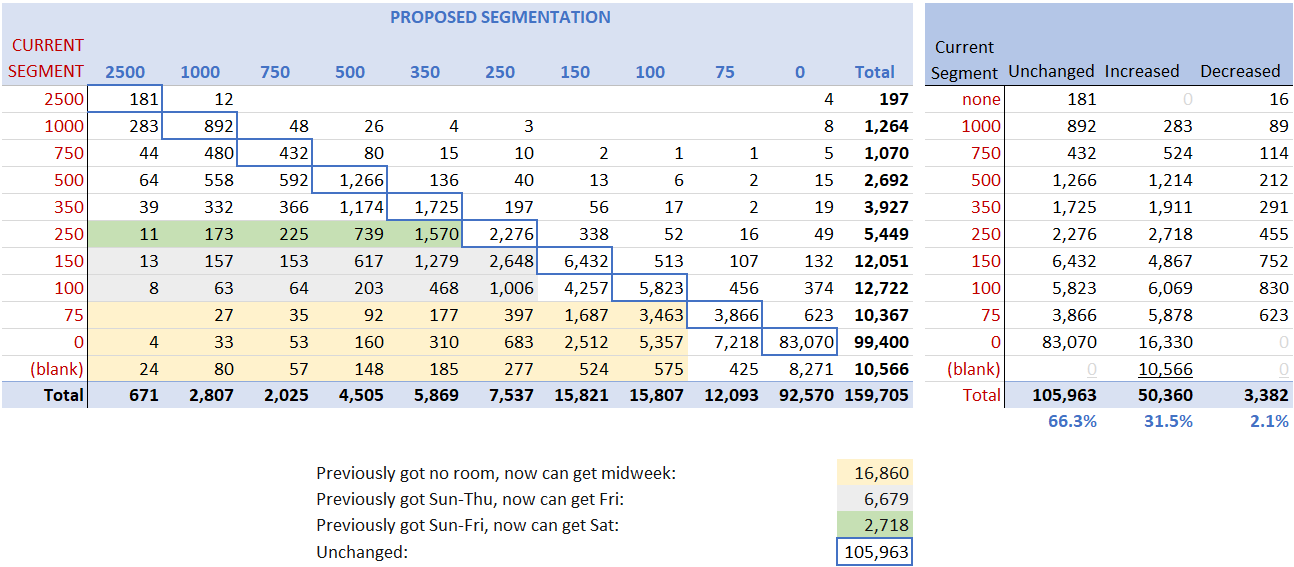
To make this less abstract, the revenue director can then add detail about the practical application of these migrations. The example below shows what these segmentation changes actually mean to players in the context of complimentary rooms.
Measurement
Presumably, most casino hotels already have a method in place to show key player statistics by segment and by month. Typical key stats would be:
| • Total Room-Nights | • Total Theo | • Total Actual Win |
| • Total Unique Players | • Average Theo | • Average Actual Win |
Assuming this method has been used for years, and the data provides a few years’ of monthly summaries, there’s a good reason to keep the pre-existing measurements in place. That is, continue to evaluate customers on the prior criteria, and run those same reports according to the prior valuations. But, once your new valuation method is figured out, store the new valuation figure in a separate column in your database, so you can compare the two side-by-side.
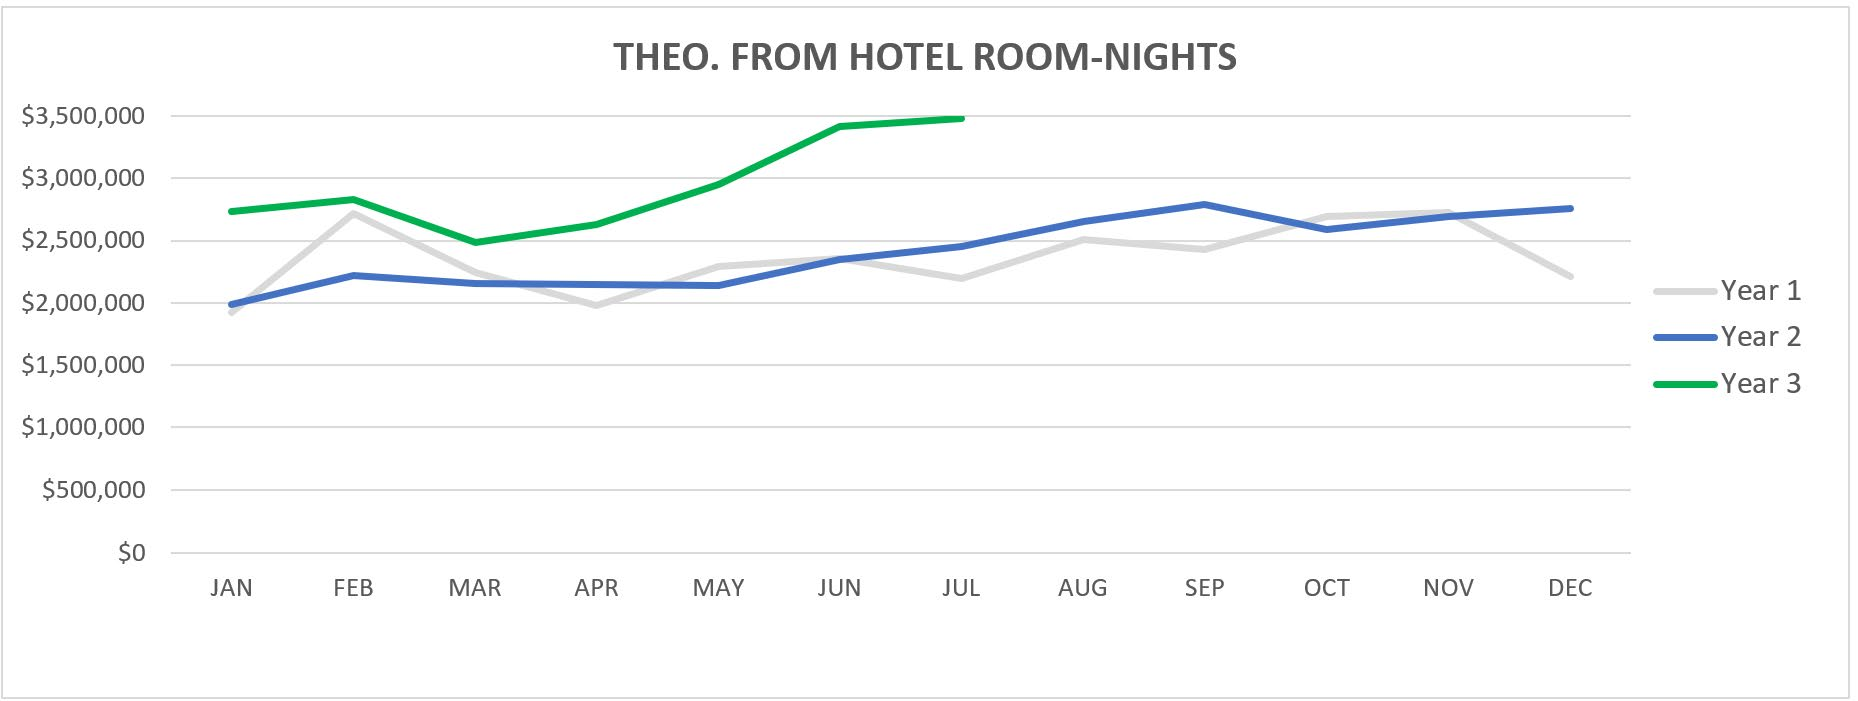
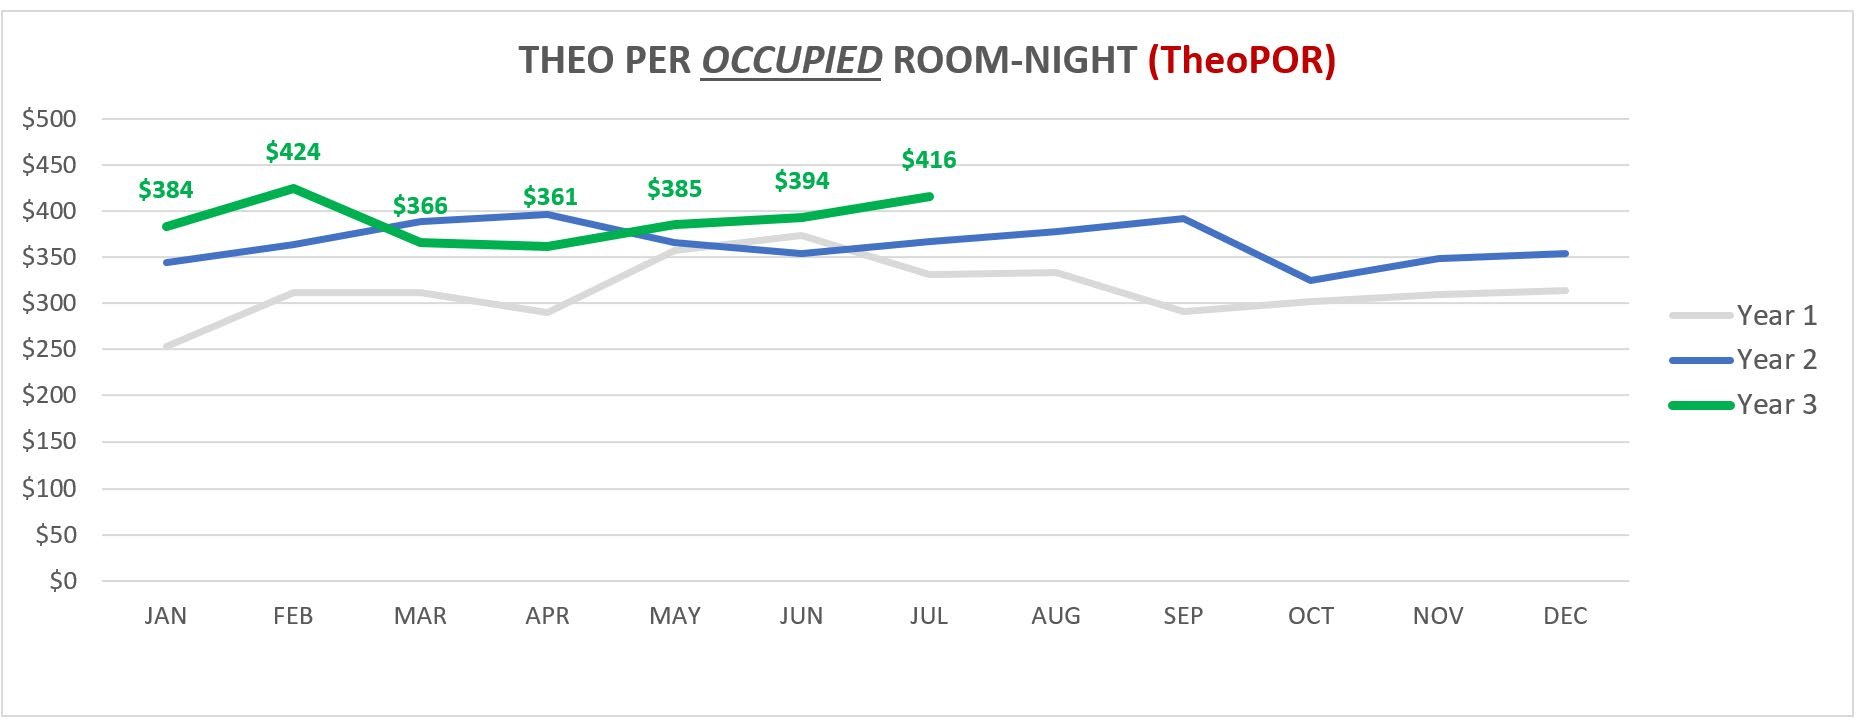
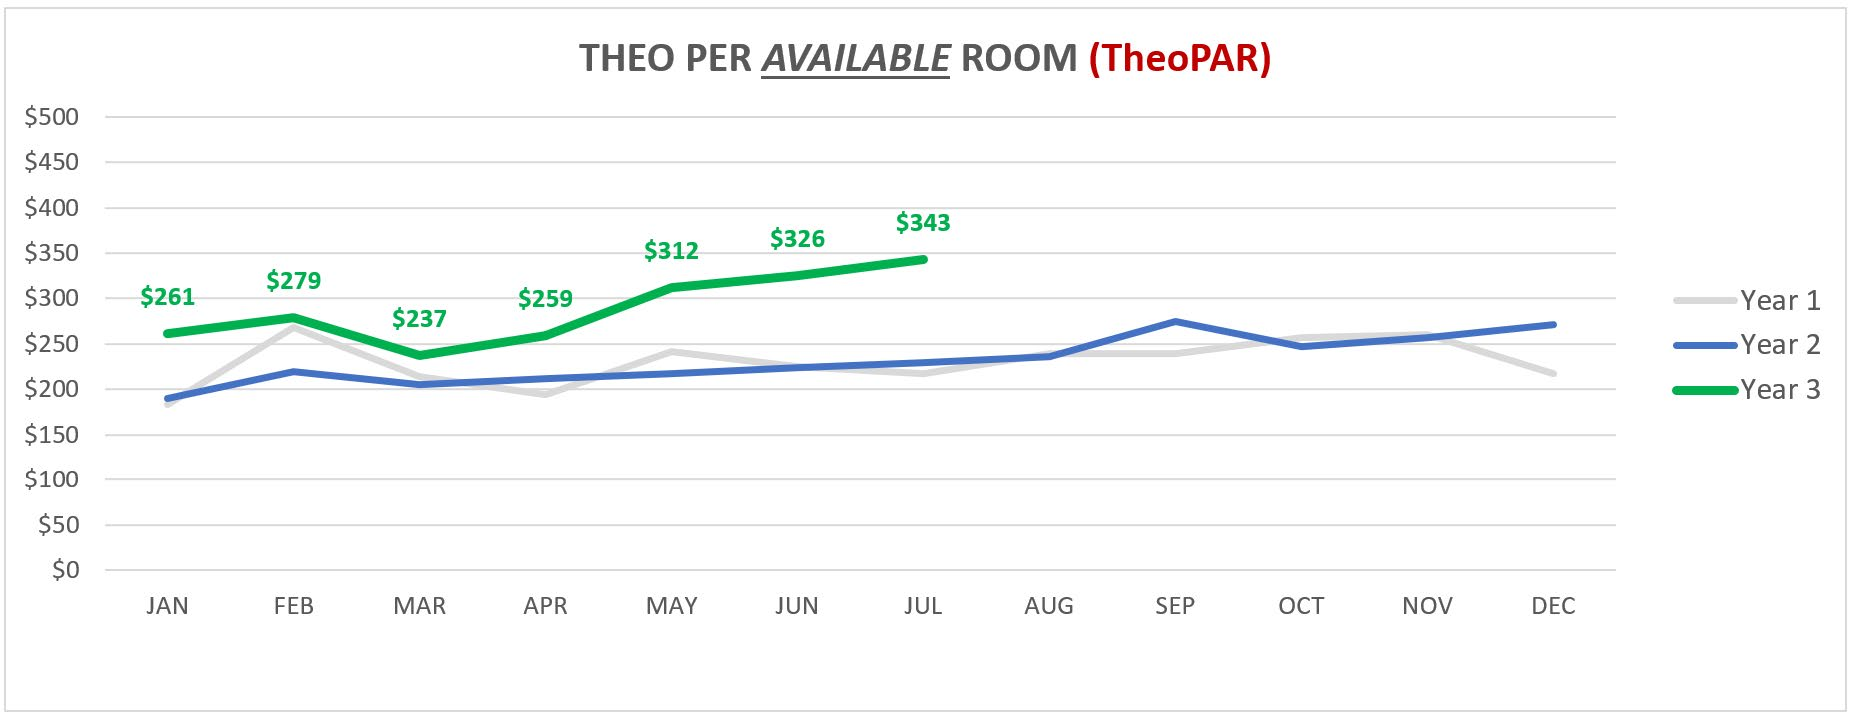
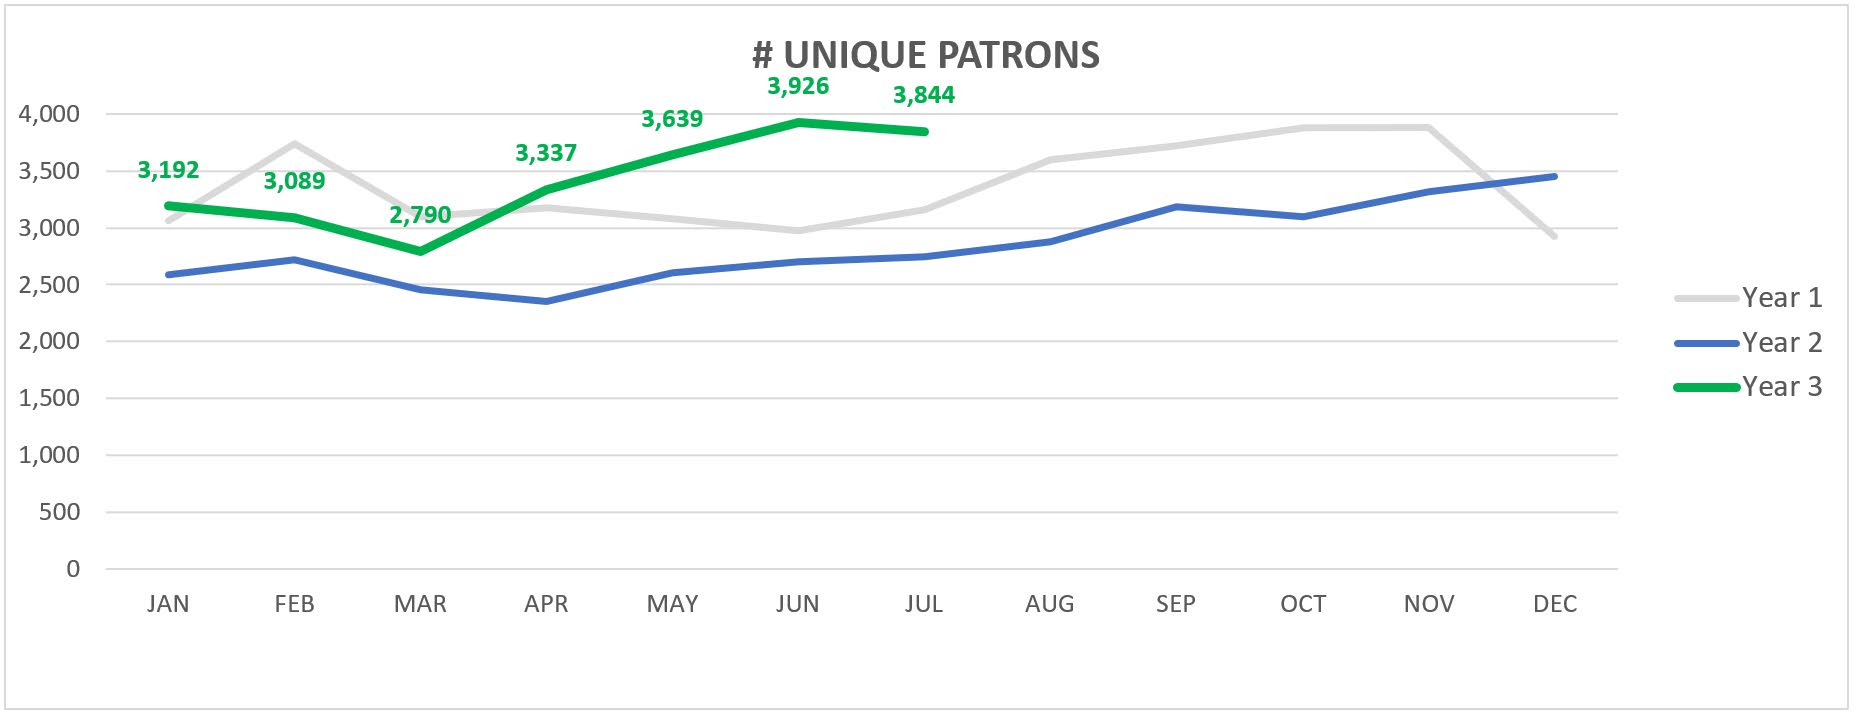
Once you begin using the new method in concert with your revenue management system (RMS) for a few months, you can run the same reports side-by-side and compare the things like your theo and worth per occupied room and per available room, the number of unique players, the total win, etc. Importantly, you’ll be able to see where your increases manifest across the different segments, and by days of the week. After a few months, if you’ve done it right, you should see positive movement in all these key measurements, and you won’t have to invent a new reporting method.
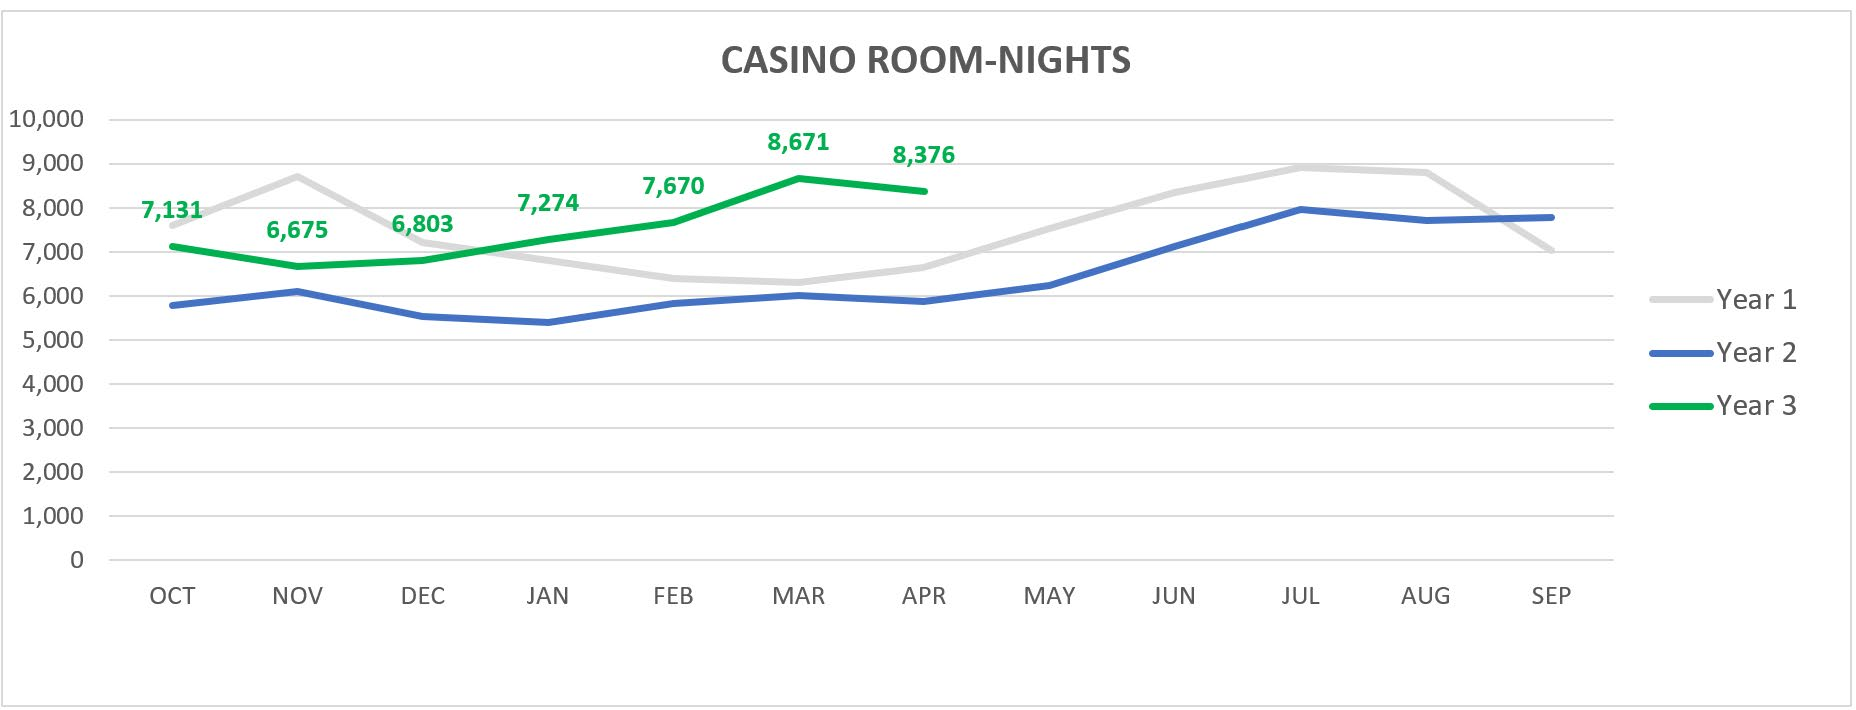
A few examples of the monthly casino rooms reports are shown below. In this fictional example, the changes were made in November of Year 2 and the take-off from there is quite noticeable. And, by using the pre-existing reporting method, there is no trickery in reporting it in a new way.
Also, a close-up of a single month shows the details at the segment level. In this fictional example, the segmentation is using the pre-existing segmentation so that the reporting against historical values is preserved.
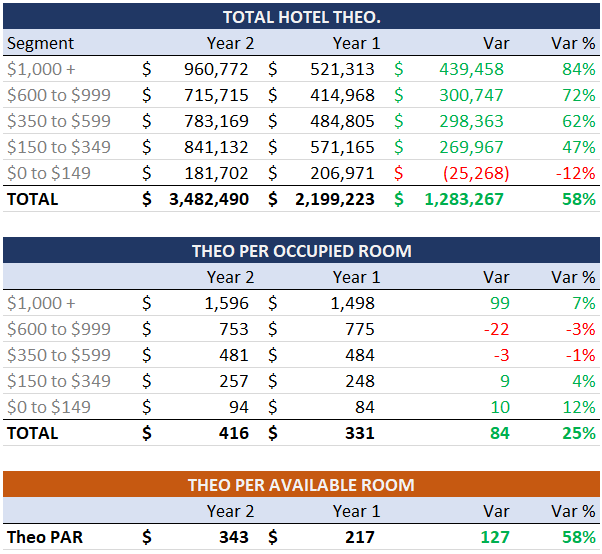
Naturally, there are many ways to analyze and measure the fruits of a casino hotel yield management program. Shown above are just a few examples, but the key takeaway is that the revenue director shouldn’t just report on production based on casino valuation; they should take ownership of what’s actually inside.