Lies, Damned Lies And Call Center Statistics
The executive’s guide to what’s worth measuring in your call center operation
by Matt Flemming
Download
Abandonment Rate
Abandonment rate simply expresses the percentage of calls offered that ended up dropping while in queue (i.e., before being answered). Needless to say, a high abandonment rate will generally raise the eyebrow of an executive focused on driving revenues. For years, call center managers have been serving this dried- out old metric to their superiors. And why not? It’s a very intuitive measure, and one of the few that have been available from telephone systems forever. In fact, abandonment rate can be a very meaningful measure when discussed with the right context. But all too often, important context simply isn’t presented along with the stat.
For instance, you may learn that your abandonment rate last month was 12%. Often, a savvy call center manager will serve up such a report along with a bonus analysis of how much additional revenue is being lost as those 12% of callers go find a competitor someplace else that will answer their call more quickly. Believe me, if you assign even a $50 opportunity cost to just a tiny percentage of those abandons (this being the fraction you “scientifically” designated as unlikely to actually call back), it can often be enough to get the hungry executive to uncap the pen that signs additional employment requisitions. Indeed, if call center managers as a group consistently want one thing, it’s more bodies to throw on the fire.
But, before snapping into action, it’s a good idea to get philosophical for a moment. Now is the time to ask a few questions:
1.) Why are our callers hanging up?
Believe it or not, you might actually have a shot at answering this one. This takes us back to context. One point of context needed in any discussion on abandonment rate has to do with caller tolerance. In this case, tolerance refers to a caller’s propensity to stay in queue waiting for an agent to become available, instead of abandoning the call. Caller tolerance has everything to do with the business environment, your product offerings and your competitive set. In fact, it may actually have very little to do with the call center itself. For instance, in a highly competitive market (say, the Atlantic City casino market) where customers are notoriously promiscuous and there’s a high concentration of competitors offering similar products and services, caller tolerance might be very low. This means that customers may be willing to abandon at a rate that outstrips your ability (or maybe your willingness) to answer within a certain threshold.
Conversely, though, a low abandonment rate (let’s use 4%) doesn’t necessarily indicate good call center health either. Again, a low abandonment rate may have everything to with a high caller tolerance for queue time. In a less competitive situation, or in the case where you offer a highly differentiated product or service (or even a particularly compelling offer or promotional campaign), callers might be willing to endure long queue times in order to make sure they get through. On the surface, this may sound like good news, but beware. Your competitors won’t sleep for long before preparing to come in and scoop up your customers. I mean, that’s why we call them competitors, right? So, it’s quite possible that a high caller tolerance may result in low abandonment rate (which looks good) but a chronically slow speed to answer (which could be absolutely toxic).
So, what can you do? Well,the first thing would be to demand that your call center manager answer the next question (see below). And sometime after that, you can throw out the abandonment rate metric altogether and look for more meaningful multi-dimensional measures, such as speed-to- answer and service level objectives.
2.) What percentage of these abandons did we really have a shot at to begin with?
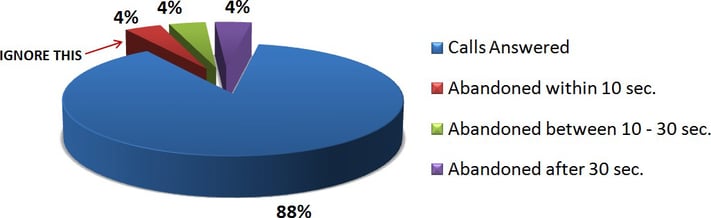
Your call center director should absolutely be able to answer this question. It may take a little coaxing to have them pull it out of your call management system, but do not accept that it can’t be done. Again, let’s use the example of a 12% abandonment rate. In such a case, wouldn’t it be important to know if one third of these abandons actually occurred within 10 seconds? If that’s the case, you might make the argument that this third of your abandoners never gave you a reasonable chance in the first place. Or, maybe you just get a lot of wrong numbers who hang up once they hear your queue messaging. Don’t laugh -- depending on your phone number, you never know -- it happens. Such a discovery might cause you to look at things differently. Indeed, with this adjustment, you’re now looking at an 8% effective abandonment rate (see figure 1). Maybe you still want to decrease it from there, but at least you won’t spend a lot of money trying to chase that other 4% who were hanging up within 10 seconds.
Figure 1 – Breakdown of Abandoned Calls
At this point, it’s a good time to introduce a new metric – Average Time to Abandon (ATA). ATA basically reports the average time your abandoners spentin queue before giving up on you. In the case of low caller tolerance, or frequent wrong numbers, the Average Time to Abandon will not seem very high. And, speaking rather broadly, where the average time to abandon doesn’t vastly outpace your Average Speed to Answer (ASA), you may not even have an abandonment problem worth chasing. At the risk of confusing things, it’s important to note that this doesn’t mean you’re without a speed-to-answer problem to solve. This goes again to the notion of focusing energy on fixing speed-to-answer rather than abandonment problems
Conversely, where caller tolerance is high, (and you’re pretty sure you’re not plagued with wrong numbers), your abandonment rate may look nice and low, even while the Average Time to Abandon is unusually high. The bottom line here is this: don’t let your director report an abandonment rate without also reporting the ATA, and having at least a vague notion of your callers’ tolerance and the realities which underlie this tolerance. Otherwise, the abandonment statistics you read may actually be lies.
3.) What percentage of these abandons is actually calling back later?
This is a very insightful question, and one we’d all like to answer. Unfortunately, for most of us, it remains largely rhetorical. You should probably pose this question to your call center director (at least to get her thinking), but, don’t spend much time and energy going after it. This is because, unfortunately, you’re just not likely to get this data without spending a lot of money for the right tracking software. And, this money is almost always better spent working on the solving the speed- to-answer and abandonment problem in the first place. You can bet that, once you get your abandonment rate down in the 3-4% range, not too many people are going to care how many of the remaining abandoners actually call back later. At that point, it’s often not meaningful information.
Average Speed To Answer (ASA)
Average Speed to Answer (ASA), simply looks at the mean number of seconds callers spent in queue waiting to be answered by an agent. Generally speaking, time spent interacting with voice-response systems or automated prompts are not factored in to the ASA metric. And, while caller tolerance is an important catalyst, there is generally a strong positive correlation between ASA and abandonment rate. High-tolerance situations aside, it’s a safe bet that if you’re abandoning a lot of calls, your customers are probably waiting too long in queue.
Having said this, it’s important to point out common pitfalls of the ASA statistic. Much like abandonment rate, the problem is that ASA is too often reported without meaningful context. The right context, in this case, can be provided by the standard deviation. Don’t worry, though, you don’t need to be an egghead to get this. In fact, you never need to actually calculate the standard deviation. You just need to understand the context it provides. For instance, it’s not uncommon for managers to take a 30-second ASA and state either, “we answer our calls within 30 seconds” or, for the slightly more cautious, “half our callers wait less than 30 seconds and half wait more”.
In either case, you should challenge your director to provide you with the standard deviation for the weekly call distribution. Try to keep a straight face while you tell her the average is meaningless without the standard deviation. Then, wait a week and if she hasn’t quit by then, use the following to explain why you need more intelligence in the ASA stat.
Figure 2 shows the ASA for 10 calls in the same period within three different call centers. Let’s assume that these samples are from three different call centers who all report an overall ASA of 30 seconds for the sample period. And, let’s assume that none of them are actually lying about that. Indeed, the mean value for speed-to-answer for all their calls clearly comes out to 30 seconds. But, the three samples do have very different distribution patterns.
Figure 2 – Three Very Different Call Centers with 30 second ASA
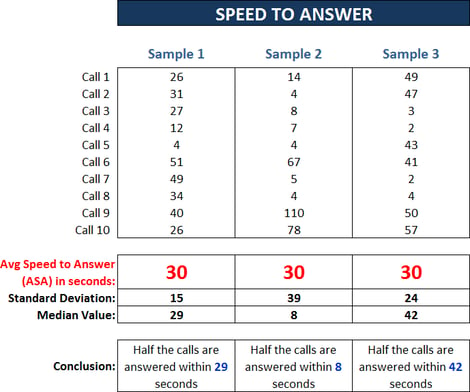
- Strictly speaking, sample 1, with the lowest standard deviation (15), has the most right to claim the 30-second ASA. This is to say that their calls tend to cluster more closely around the 30-second mark than the other samples.
- The call center in Sample 2 clearly has a knack for answering calls quickly, except for a few drastic outliers which, in a more real-world (i.e. much larger) sample might represent a scheduling or call-out problem on a single shift. What’s interesting about Sample 2 is that, although they report an ASA of 30 seconds, they never really seem to get near 30 seconds at all. In this feast-orfamine sample (which is not exactly unusual given the random call-arrival patterns inherent in most call centers), the ASA statistic is grossly misleading. In fact, the call center management team is actually selling themselves short with this ASA measure. Indeed, half of their calls are actually answered within only 8 seconds, but the high standard deviation (39) accounts for this discrepancy. This large deviation, by the way, is symptomatic of the challenges inherent in smaller call centers or answering groups. So, the smaller your center, the more you need to understand the standard deviation and the misleading effect it can have on your ASA metrics.
- Sample 3 claims an ASA of 30 seconds, but really seems to be more consistently hitting in the 45-55 second range. It’s just that those 3 calls that came in under 5 seconds have grossly understated this caller center’s ASA. In this case, the call center is actually doing considerably worse than the statistic. Again, it’s the standard deviation of 24 that helps them perpetrate this (damned) lie.
The bottom line with ASA is that, like most averages, the statistic can be very misleading, particularly when reported across many time intervals which might have different behaviors. To get the truth out of your ASA, you need to understand the context provided by the deviations in your samples. So, in order to best mitigate the effects of wide deviations, it’s best to report ASA in the smallest time interval possible. That way, the chronic staffing problem you may have on night shift (for instance) which causes the 150-second ASA doesn’t get masked by the nice 20-second ASA you enjoy on day shift. And, while looking at ASA for each quarter-hour might be a little much for summary reporting, it’s absolutely critical for your workforce planning manager to use in forecasting. A good bet for summary reporting, then, would be to show ASA for day-parts (such as day, swing and grave shifts), as opposed to the showing ASA for the whole day.
Understanding Your Call Profile
When looking at your ASA and service level performance, your call profile is another thing you might want to begin to digest. Basically, your call profile maps the distribution of your calls over a certain period using a simple histogram, showing how many calls your center answered and abandoned within certain ranges of seconds.
Figures 3a & 3b – Call Profile by Month
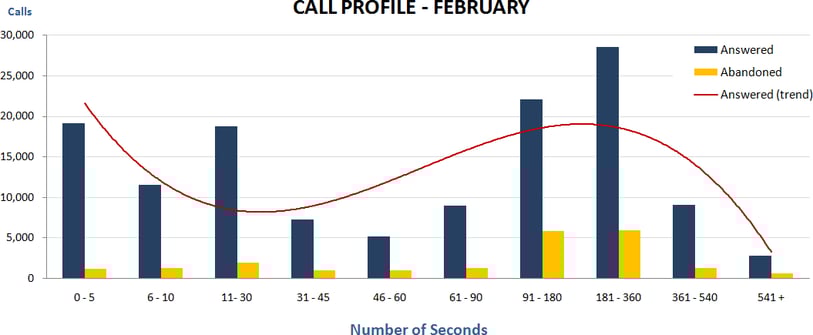
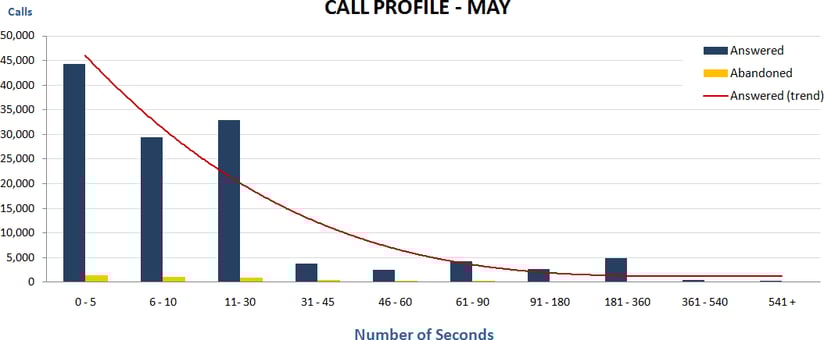
As you can see, the call profile will give you a sense for some things that other data (especially averages) won’t show. For instance, the call profile can clearly show your outlying data, such as the calls answered or abandoned after more than 9 minutes. Using the comparison of the two months shown above, it’s clear to see how one curve represents much faster service than the other. And, what’s interesting is that you can also use this information to compare one month to another in terms of other things like total queue time and the toll charges associated with it.
Fortunately, unlike SLO, I do not suggest that a detailed call profile is something you’ll want to analyze at a very granular level. But, at the end of every month, it’s a good idea to take your own temperature by looking at this data, and at least running it by day of week. You might be surprised what you’ll find.
Agent Occupancy
Needless to say, an executive of your caliber knows all about occupancy. If you’re in the hospitality business, for example, you surely manage (or at least consume and/or react to) hotel occupancy figures all the time. As well, you might be dealing with occupancy measures in your table games, slots, and restaurant operations. The good news is that call center agent occupancy isn’t a whole lot different, at least in that there is a definite “sweet spot” or a desired occupancy range which optimizes the resources at hand without stretching them unduly. (NOTE: For those in the hospitality sphere, if you still think 100% is always the right occupancy number for your hotel, stay tuned for the new truth in a future article on revenue management).
Agent occupancy can best be described as the average percentage of call center agent’s staffed time (excluding breaks) spent either talking on a call or handling associated wrap-up work. So, agent occupancy is more or less a measure of how productive your call center agents are. Interestingly, this is the first measure we’ve discussed which can be expressed at an individual agent level, so you should be able to tell when agents on a particular shift, or those servicing a particular queue are more or less occupied than others. But, be careful -- because while occupancy can be measured at the individual agent level, it isn’t exactly intended for use that way.
So long as an agentis adhering to their scheduled start times and break, then the agent occupancy number is largely out of their control. (For call centers with a workforce management system, we can introduce a very important metric called “Agent Adherence” that deals with this.)
But, instead of talking about occupancy, it’s often easiest to look at the converse measure – idle time. Simply stated, the opposite of occupied time is idle time. And, as we all know, if there’s one thing cost- conscious executives seem to hate, it’s hourly employees sitting idle. The fact, however, remains that all call centers have a requisite amount of idle time. Indeed, this is what allows agents to be available to service calls in a random-call-arrival environment. The difference between this and other operational areas is the very element that can shock some executives – the fact that amount of idle time is so readily (and unapologetically) reported in the call center, while it goes largely unexpressed in other areas.
Anyway, as much as occupancy is a valuable metric to explain what’s going on in your center, it should be much more than a metric you report as an output. Done right, an agent occupancy level should be set as an objective, much like SLO. By setting a goal for agent occupancy, you are, to a great extent, deciding what type of center you want to run. For instance, do you want agents to be handling one call after another with no time to catch their breath, or do you want to build in some time to regain composure between calls and allow for more on-the-spot team communications? While there will be great variations based on the size of your call center, many would agree that’s it’s advisable to keep agent occupancy for the mid-sized center below 82%. Below are some quick points to consider regarding agent occupancy:
- High occupancy generally makes it harder to enjoy ad-hoc communication with your agents in between calls.
- High occupancy increases productivity in the short-term, but can lead to costly burn-outin the long term.
- Generally speaking, increased occupancy correlates with higher ASA and missed service levels.
- Higher occupancies will generally reduce your cost-per-call measures.
- Higher occupancies can best be achieved with minimal negative side effects only as the call center grows in size. This is why there is often a case to be made to consolidate call center operations (more on this below).
Once you understand Service Level Objective and Agent Occupancy, it becomes easy to see that SLO is something you can dial up or down depending on your tolerance for wait times. And, this dial has great impact on your agent occupancy as well. Figure 4 below shows an example of the agent idle time required for the same call center using varying service level objectives.
Figure 4 – Dialing Down the Service Level Objective Increases Agent Occupancy
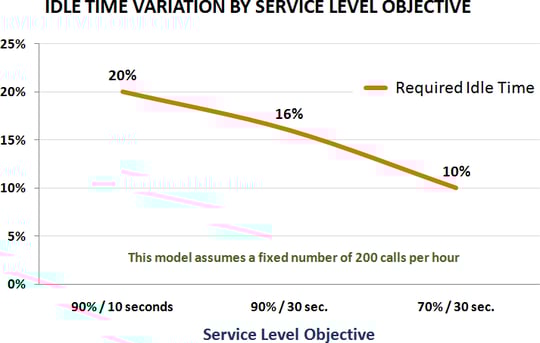
In this case, it’s remarkably clear that required agent idle time can be cut in half by setting a less stringent service level objective. In the rather extreme example of 90/10, required idle time is 20%, but a change to 70/30 drops this requirement to 10%. When deciding how to set a service level objective, it’s very important to run such a test. All too often, service level objectives are set rather arbitrarily based on what “sounds right”. But, minor changes afforded by an understanding of caller tolerance can reap great rewards in terms of agent occupancy – and these are the kind of rewards that go straight to the bottom line (our favorite kind, right?).
In addition to service level objectives, another dial you can turn has to do with the sizing of your center, as measured in the number of calls offered in a peak half-hour. An exploration in re-sizing is not for the faint of heart, however. Assuming that your goal isn’t to simply drive more calls, we’ll assume that re-sizing the call center means centralizing all the varied call center operations at your property into a single outfit. Indeed, it seems that consolidation of call center operations seems to be on the to-do list of many executives these days. This is, in many cases, a noble and worthy effort, but it is also one that can be met with great political opposition, the many facets of which could fuel another long-winded paper. But for now, we’ll look simply at the numbers.
In case you didn’t already know it, smaller call centers are inherently less efficient than larger ones. It’s important to note that this is an immutable reality, grounded in foundational statistical theory and supported by countless traffic studies. It is not a judgment about a particular call center’s (or manager’s) effectiveness. A good way to illustrate this would be to analyze the amount of agent idle time required to meet a given service level goal in call centers of varying size. Figure 5 assumes a service level objective of 90/30 and an average call duration of 340 seconds.
Figure 5 – Effects of Call Center Sizing on Required Idle Time
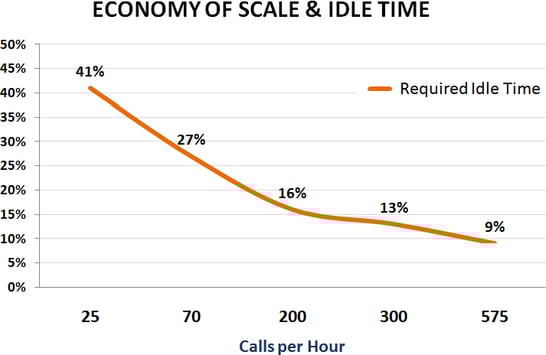
In this example, it’s clear that, in order to meet the stated service level goal, the required agent idle time can be dramatically reduced as the size of the call center is increased.
So, to bring it all together, Figure 6 shows both dials in action. That is, it shows how changes in both service level objective and call center sizing can impact required agent idle time. Quite clearly, you can see that the larger call center with the less stringent service level allows the greatest efficiency
Figure 6 – Bringing It All Together
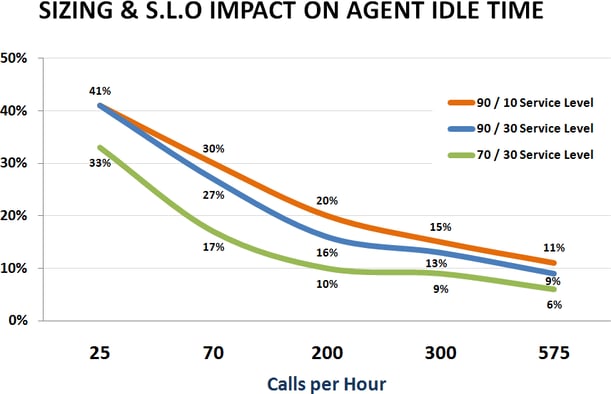
- So, in a center that only handles 25 calls per half-hour, a service level goal of 90/10 would require that agents are occupied only 59% of the time. That means, to meet the aggressive service level goal, you’d need to plan to have your agents spend a staggering 41% of their staffed time waiting idly for a call to arrive. And, this excludes their breaks.
- In the same center, loosening the service level goal to a more reasonable 70/30, you can reduce your required idle time to only 33% (i.e., increase your occupancy to 67%).
- Or, another way to increase your occupancy (i.e. reduce your idle time) is to move along the xaxis and increase the number of calls per half-hour. At a 70/30 service level objective, a call center that handles only 25 calls per half-hour requires 33% idle time, while a center with 575 calls per half-hour and the same SLO can get by with a mere 6% idle time.
Finally, no discussion on service level objectives and agent occupancy would be complete without an important caution. It’s critical to keep in mind that these measures are designed as much for the internal health of your organization as they are for the benefit of your customers. For instance, you may find that 88% agent occupancy is quite achievable in your larger call center. But, the corresponding strain on your associates may be costing you too much in the long run, and you may find that something like 82% is less than your maximum capability, but better suited for your internal well-being. This is why many of these samples show a higher occupancy than has been recommended for a mid-sized center.
Cost-Per-Call
Another key measure you’re probably not getting from your call center director is cost-per-call. This is an extremely simple and informative measure, and the ability to report it is constrained only by the limitations of your payroll system and the technical savvy of your call center director. In its purest form, cost-per-call is calculated by taking the raw payroll dollars in a period (usually a month) and dividing it by the number of calls handled by that answering group.
Many call centers opt to blend management payroll and other elements such as rent, electricity, telephone toll charges, etc. into cost-per-call, but I almost always recommend using the purest version described above. If you have separate job codes (sales and service, for instance) handling separate call types, you’ll probably want to run a cost-per-call analysis on each job separately. Figure 6 shows an example of a report you should be getting from your call center director.
Figure 7 – Cost per Call Reported by Job Code
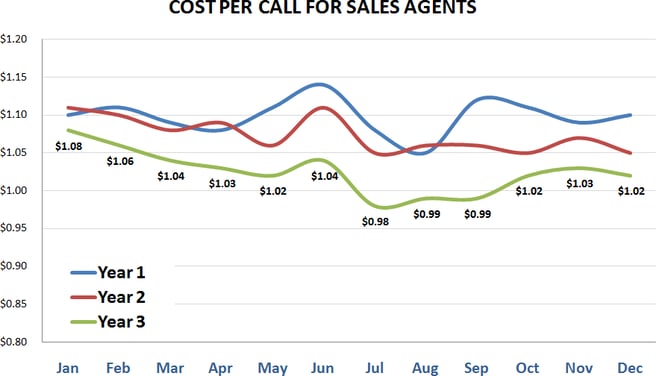
Cost-per-call is another one of those measures that may seem like a golf score on the surface. But, the reality is that lower isn’t always better. For instance, the example above shows how, in summer months, certain seasonal call centers will often show a lower cost-per-call. But, what it doesn’t show is the trade-off that can come in the form of a higher average speed to answer (ASA) as the call volume increases for the peak season. What you should expect to be seeing from your call center director, though, is a reduction in cost-per-call over the long term (like above), in conjunction with consistent service level production.
So, as you wade into these new waters, there are a few approaches you can take. Of course, you can always take the “let sleeping dogs lie” approach, assume the call center is running at peak efficacy, and focus your attentions elsewhere. But, let’s be honest – hasn’t this approach been done to death? Besides, you’re there to make a difference. So, why not blaze a new trail and give your call center director something new to think about? Driving your management team to produce more meaningful metrics will undoubtedly lead them to uncover new gains in productivity and effectiveness, while impressing them with the depth of your previously untapped call center expertise. In the process, you may discover one of the greatest things about running a call center – the fact that you can measure and report on just about everything. While this can be a curse for some, let it be a blessing for you. After all, you’ll be one of the few who can sort the statistics from the lies